Legends GeoGrid: Local SEO You Can See on a Map
By Agrici Daniel | October 19, 2026
An open-source Google Maps rank checker with updated interface screenshots, local leaders, business-name reviews, and six historical maps.

A business can look strong for one service and barely appear for another, across the very same locations. Put those results on a map and the conversation gets much more useful.
That's why Legends GeoGrid caught my attention. It brings local ranking evidence, maps, and reporting into a workflow you can run yourself. The appeal is the control: choose a useful question, inspect the observations, and build a report that explains what to investigate next.
Disclosure: Legends GeoGrid is built by my partner Benjamin, as disclosed in my Local SEO Brain article.
Legends GeoGrid is an open-source Google Maps rank checker. It uses geographic search origins to show where a business appears, supports comparisons across services, and produces local HTML and PDF reports. Fresh ranking collection uses your DataForSEO account. The source is MIT licensed. Project source.
What makes it worth a look
- Compare services across the same locations instead of relying on one ranking number.
- Keep the observations, maps, and report files in your own workflow.
- Explore saved evidence before paying for a fresh scan.
- Budget for the ranking data separately from setup and analysis.
- Use the map to frame a decision, then check it against the business.
A closer look at the updated interface
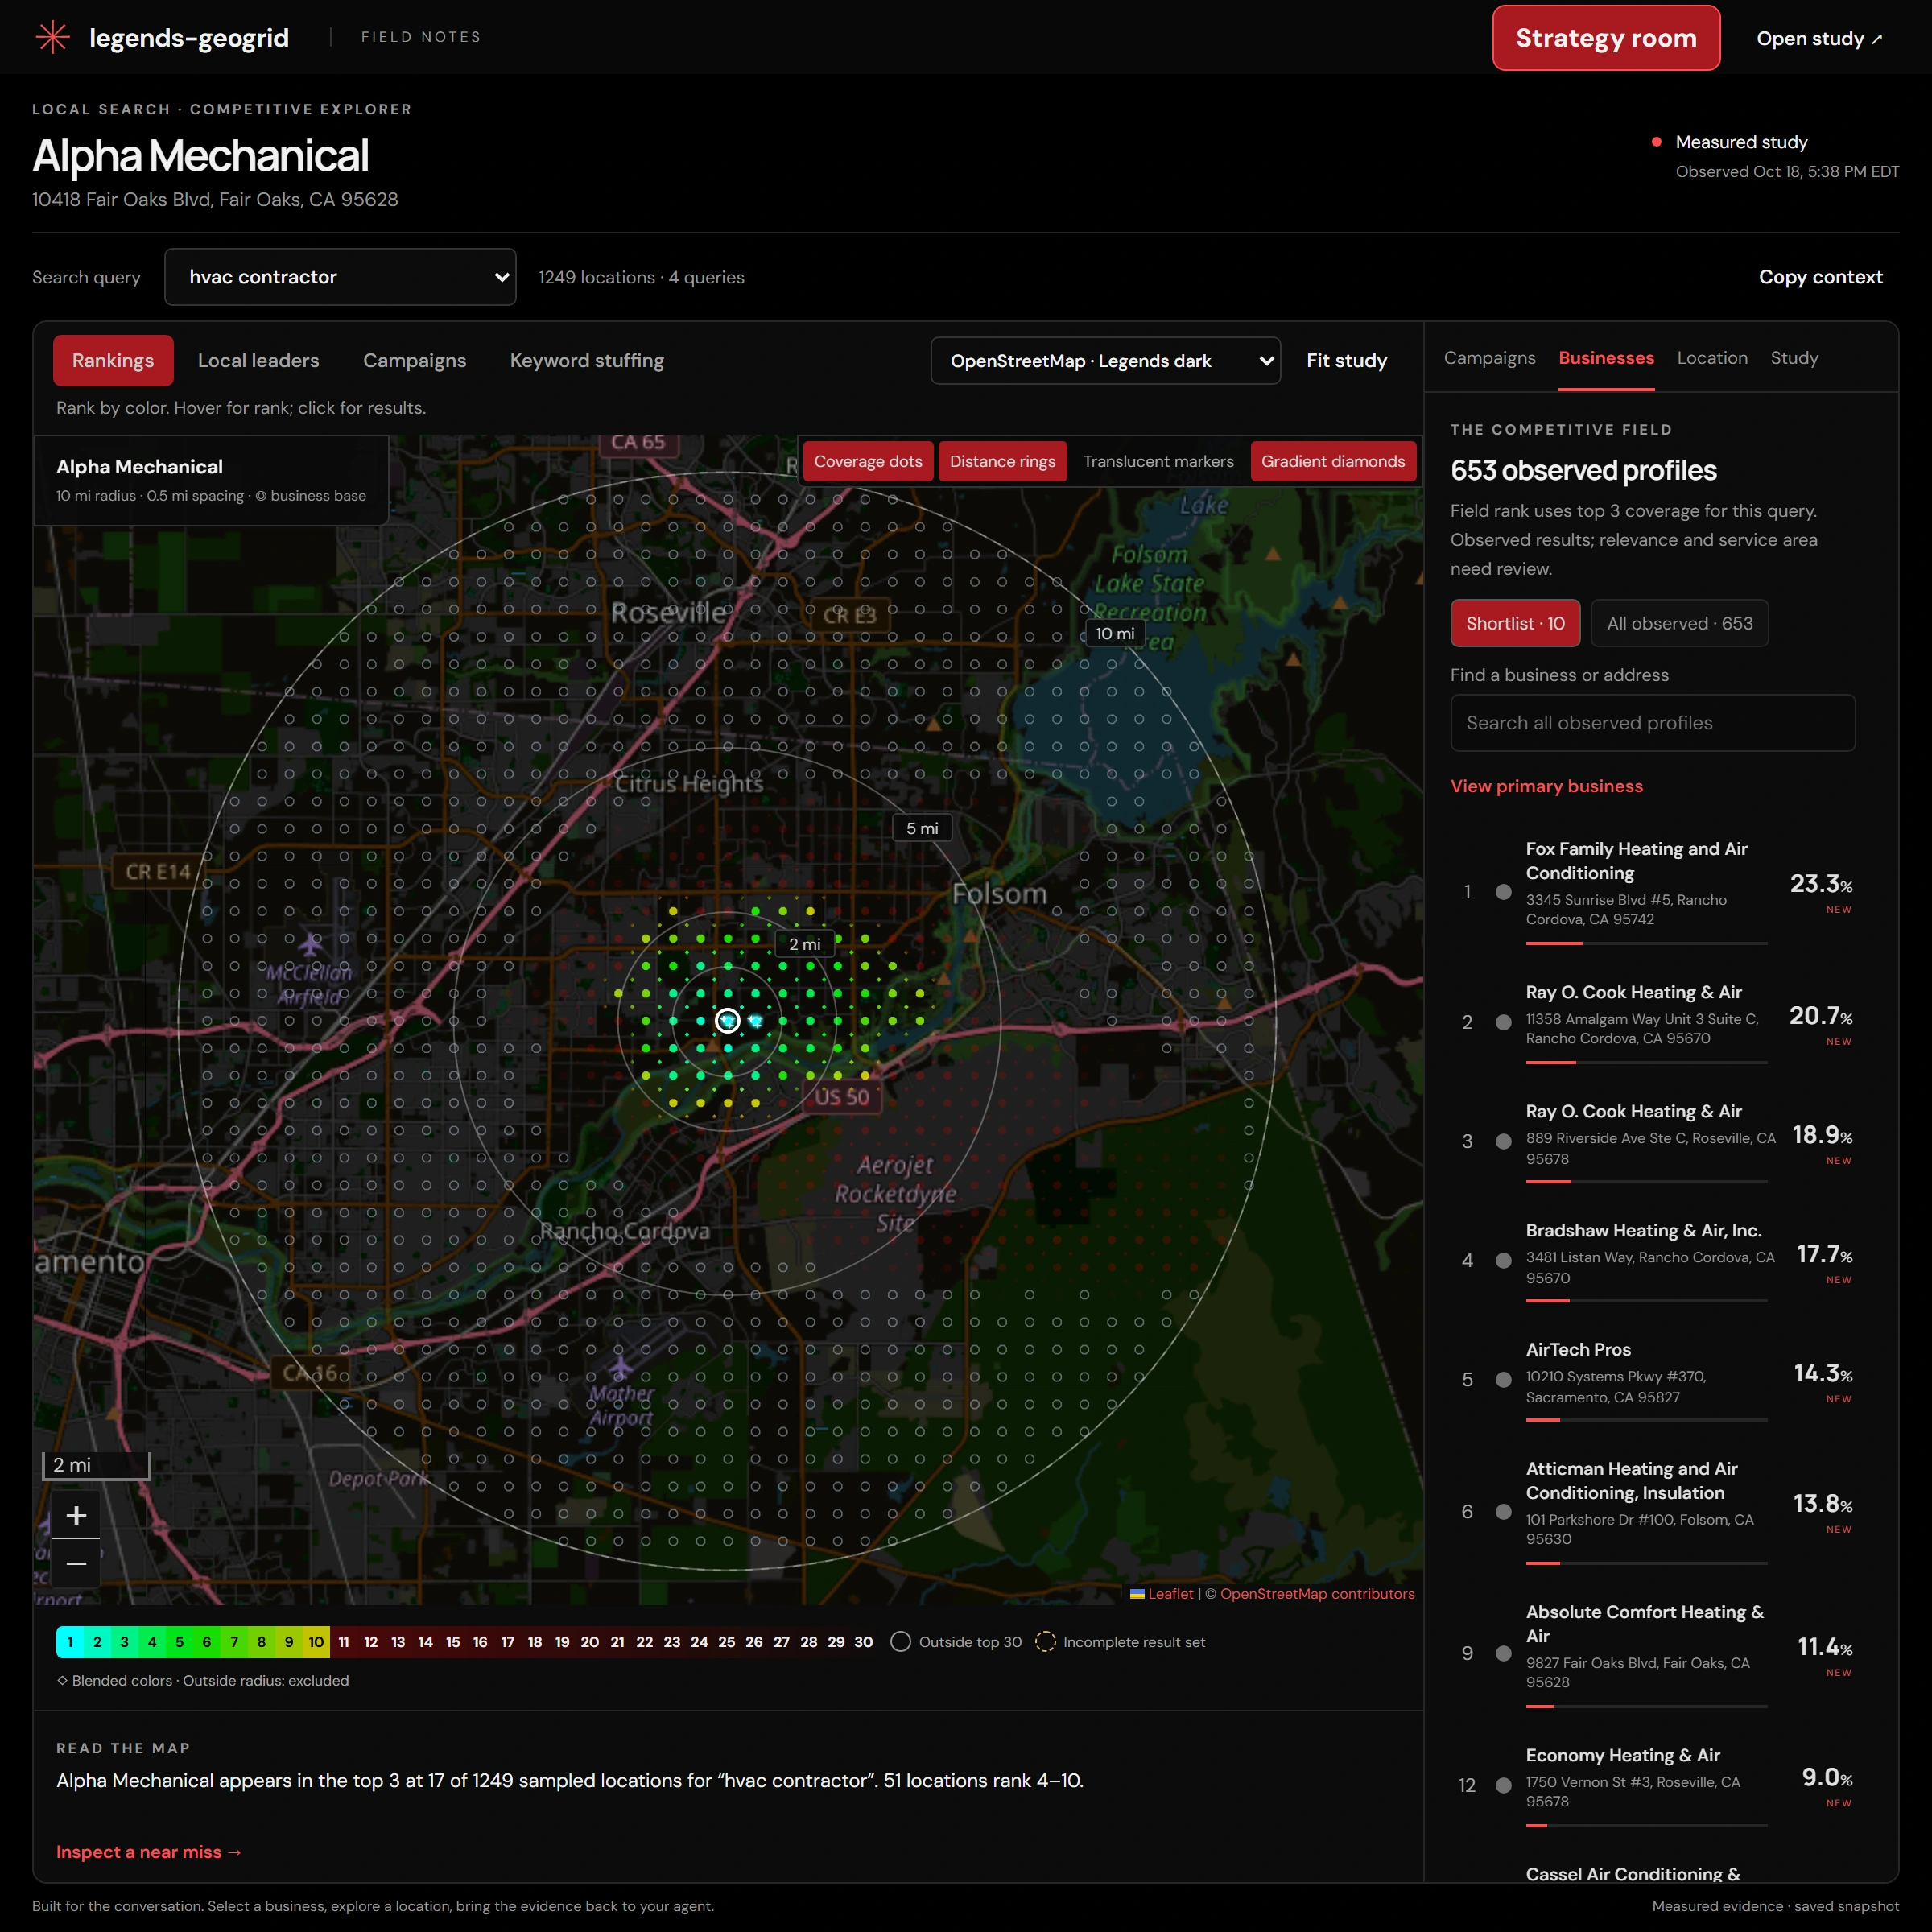
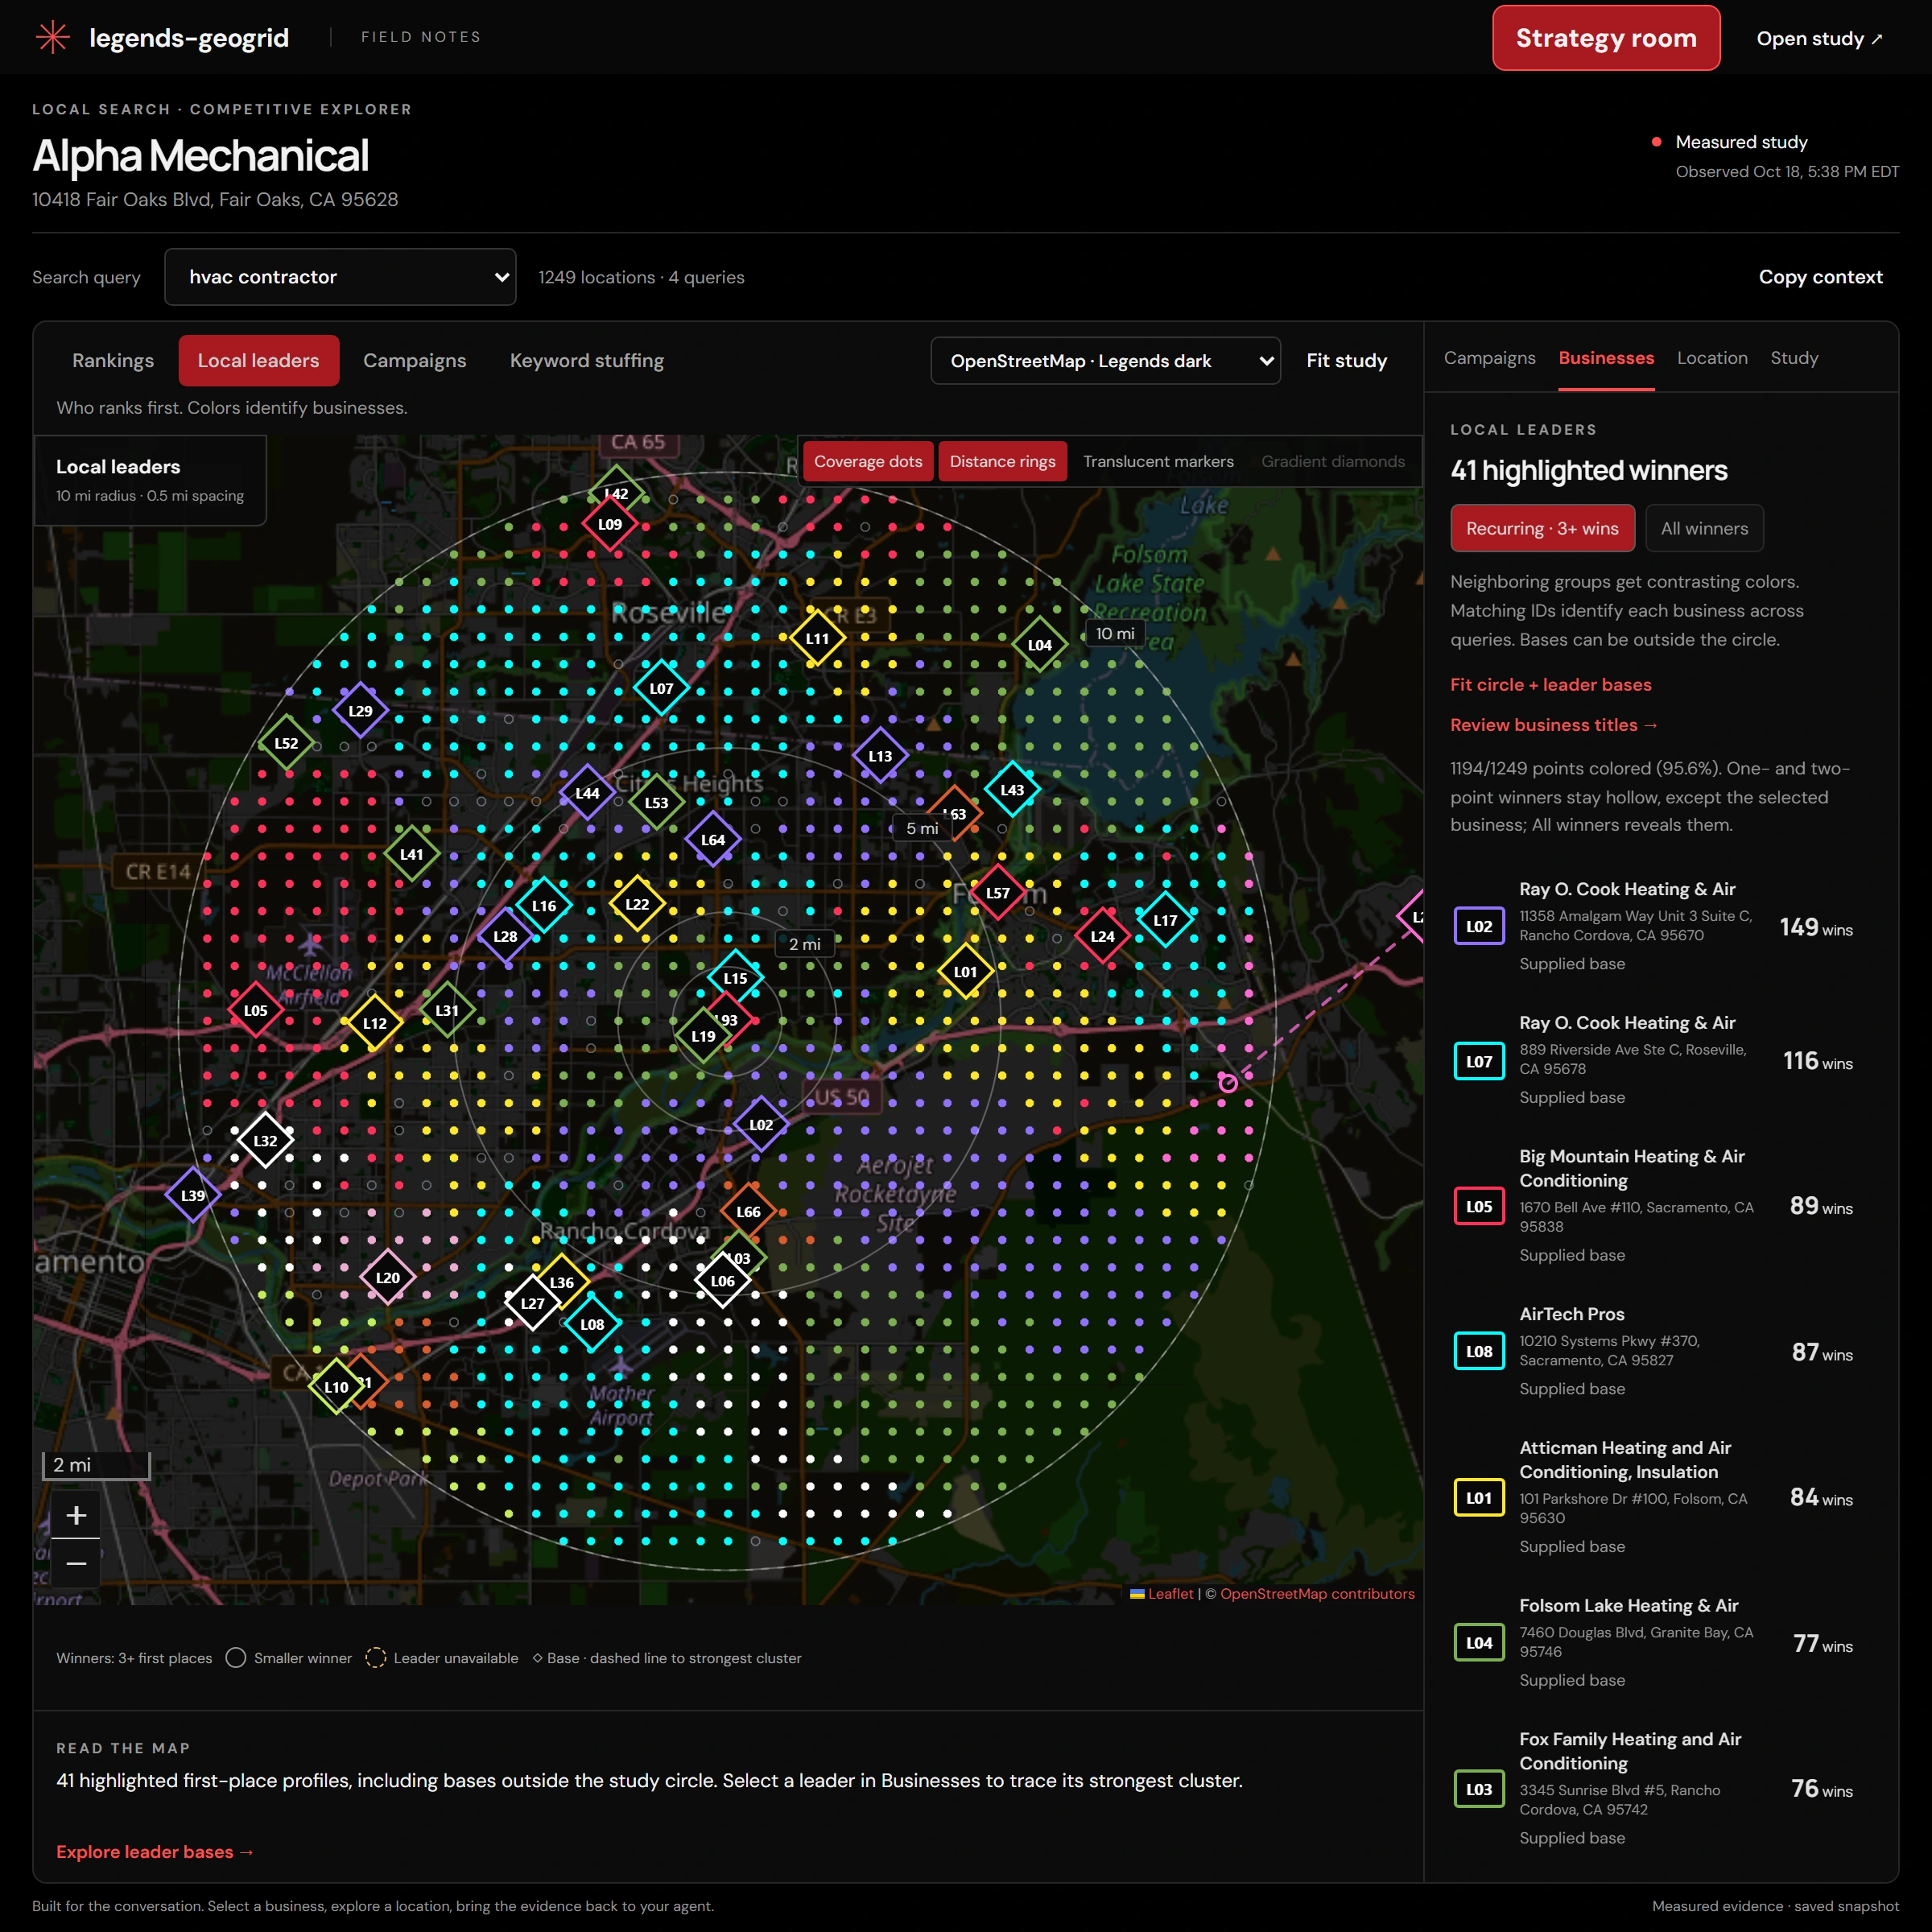
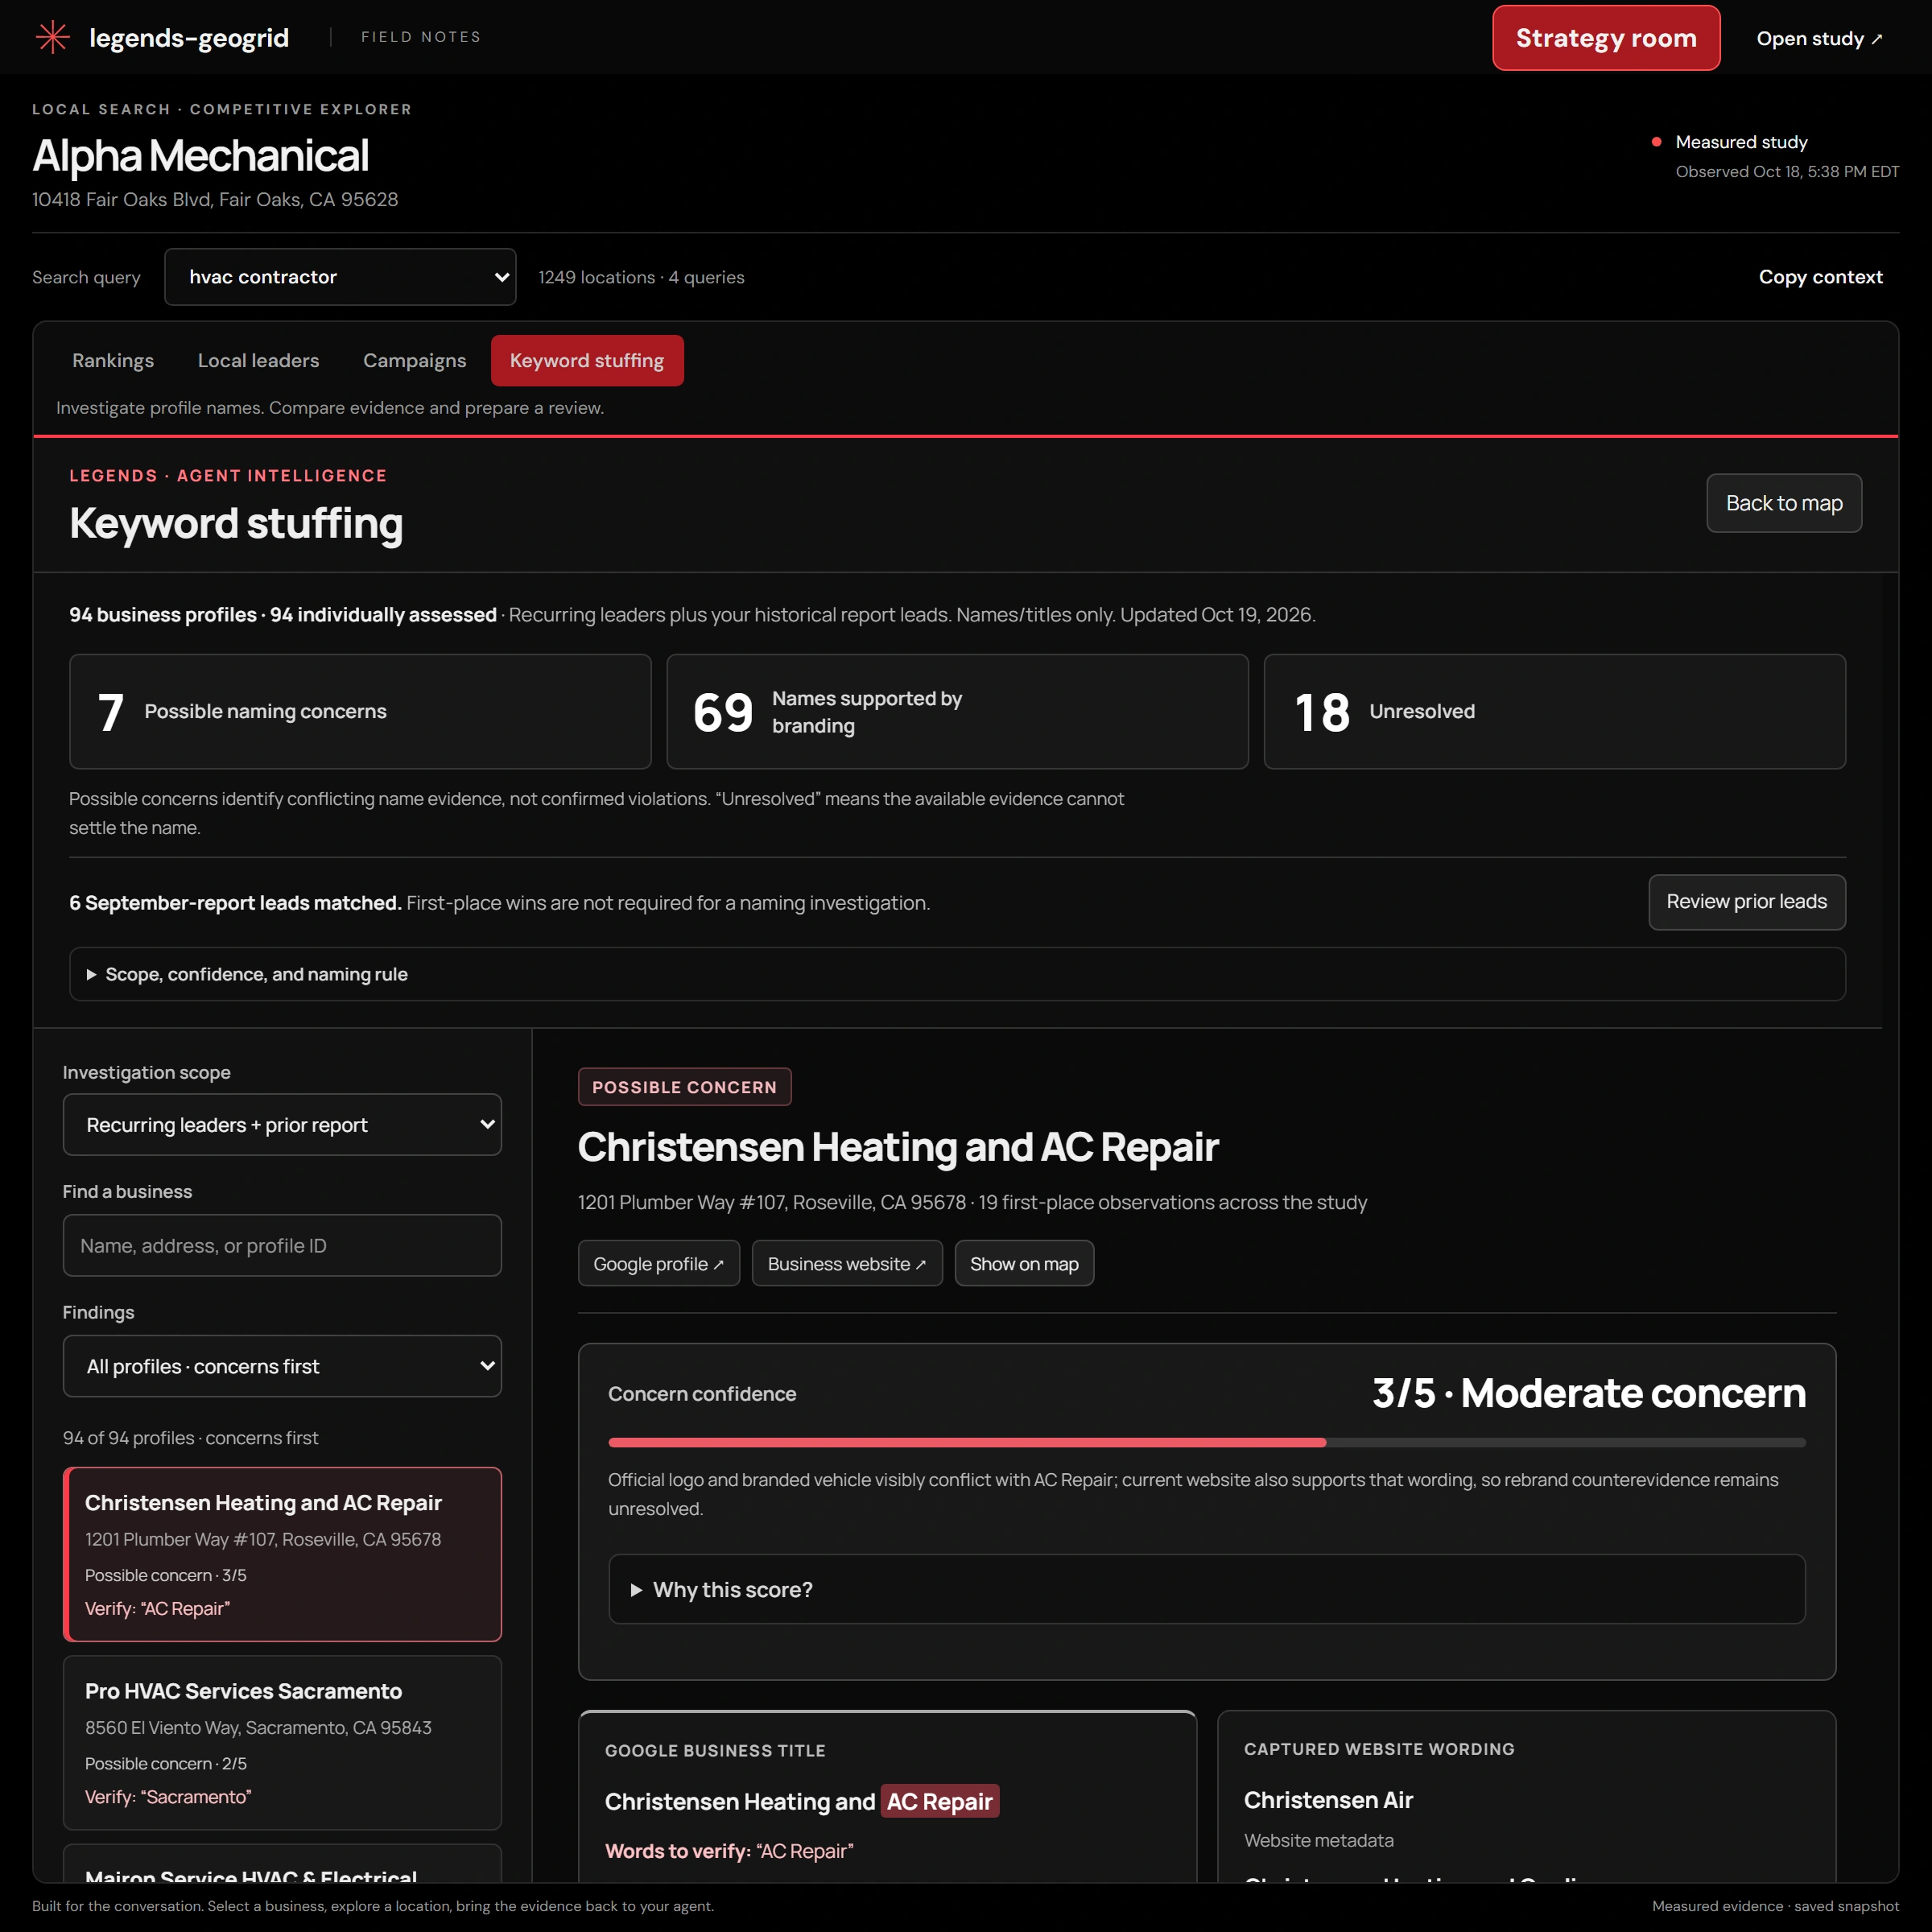
These supplied screenshots show the competitive explorer for Alpha Mechanical in the Sacramento area. They bring the newer interface into view before the September report examples below: one business's rankings, the local winners, and a business-name review.
Rankings: one business across the study
In this supplied snapshot, Alpha Mechanical appears in the top three at 17 of 1,249 sampled locations for hvac contractor. Another 51 locations show ranks four to ten. That gives the analyst a specific pattern to investigate before deciding what to change.
Local leaders: see who ranks first
The Local leaders view changes the question to which business ranks first at each origin. This screenshot highlights 41 profiles with the recurring-winner filter selected. Business colors and labeled base markers make the geographic pattern easier to follow.
Business-name review: check the evidence
The Keyword stuffing tab compares profile titles with captured branding and source evidence. In this supplied review, 94 profiles are assessed: seven have possible naming concerns, 69 have names supported by branding, and 18 remain unresolved. A possible concern is a prompt to verify the name, not a confirmed Google policy violation.
The current companion guide documents these views. The screenshots are saved study evidence supplied for this update; this article did not run a fresh ranking scan or independently authenticate the underlying provider responses.
The useful question is where customers are searching
Google's local ranking guidance identifies relevance, distance, and prominence as the main factors. Location therefore belongs in the analysis. A search from one neighborhood cannot describe every other neighborhood. Google Business Profile Help.
If you are building a wider workflow, my Local SEO Brain guide covers the business context and approval steps around this kind of evidence.
A geographic grid makes that variation visible. Each sampled origin represents a search from a specified location under recorded settings. The dots help you ask more precise questions: where does this profile appear, which service looks weaker, and where would more evidence change the decision?
Keep the denominator in view. Top-three appearances at sampled origins describe those observations. They do not measure the percentage of customers, land, or revenue a business controls. The companion documentation makes the same distinction and keeps incomplete results separate from confirmed absence. Companion guide.
One business, four services, very different maps
The supplied Sunshine Coast report is a useful example. It examines Sunshine Coast Plumbing and Hot Water across four queries on a shared grid: plumber, emergency plumber, hot water repairs, and blocked drains.
The report records a 21 September 2026 snapshot, with a 17 × 17 grid at 2.5 km spacing across a 40 km square. It excludes 82 water origins and reports 207 land origins per query. Those are the source report's stated collection details; this article has not independently audited its raw acquisition records.
| Query | Found in returned results | Top-three appearances | Top-ten appearances |
|---|---|---|---|
| Plumber | 59 / 207 | 2 / 207 | 27 / 207 |
| Emergency plumber | 86 / 207 | 5 / 207 | 37 / 207 |
| Hot water repairs | 144 / 207 | 46 / 207 | 115 / 207 |
| Blocked drains | 33 / 207 | 1 / 207 | 11 / 207 |
Source: Sunshine Coast Maps Visibility Report, supplied PDF, pages 2 to 7. Each query has its own denominator of 207 valid measured origins. These are reported observations, not independent verification or current rankings.
Hot water repairs provides a strong starting point
The hot water repairs query has 46 top-three appearances and 115 top-ten appearances among the 207 sampled land origins. It is the strongest of these four service lanes by both measures.
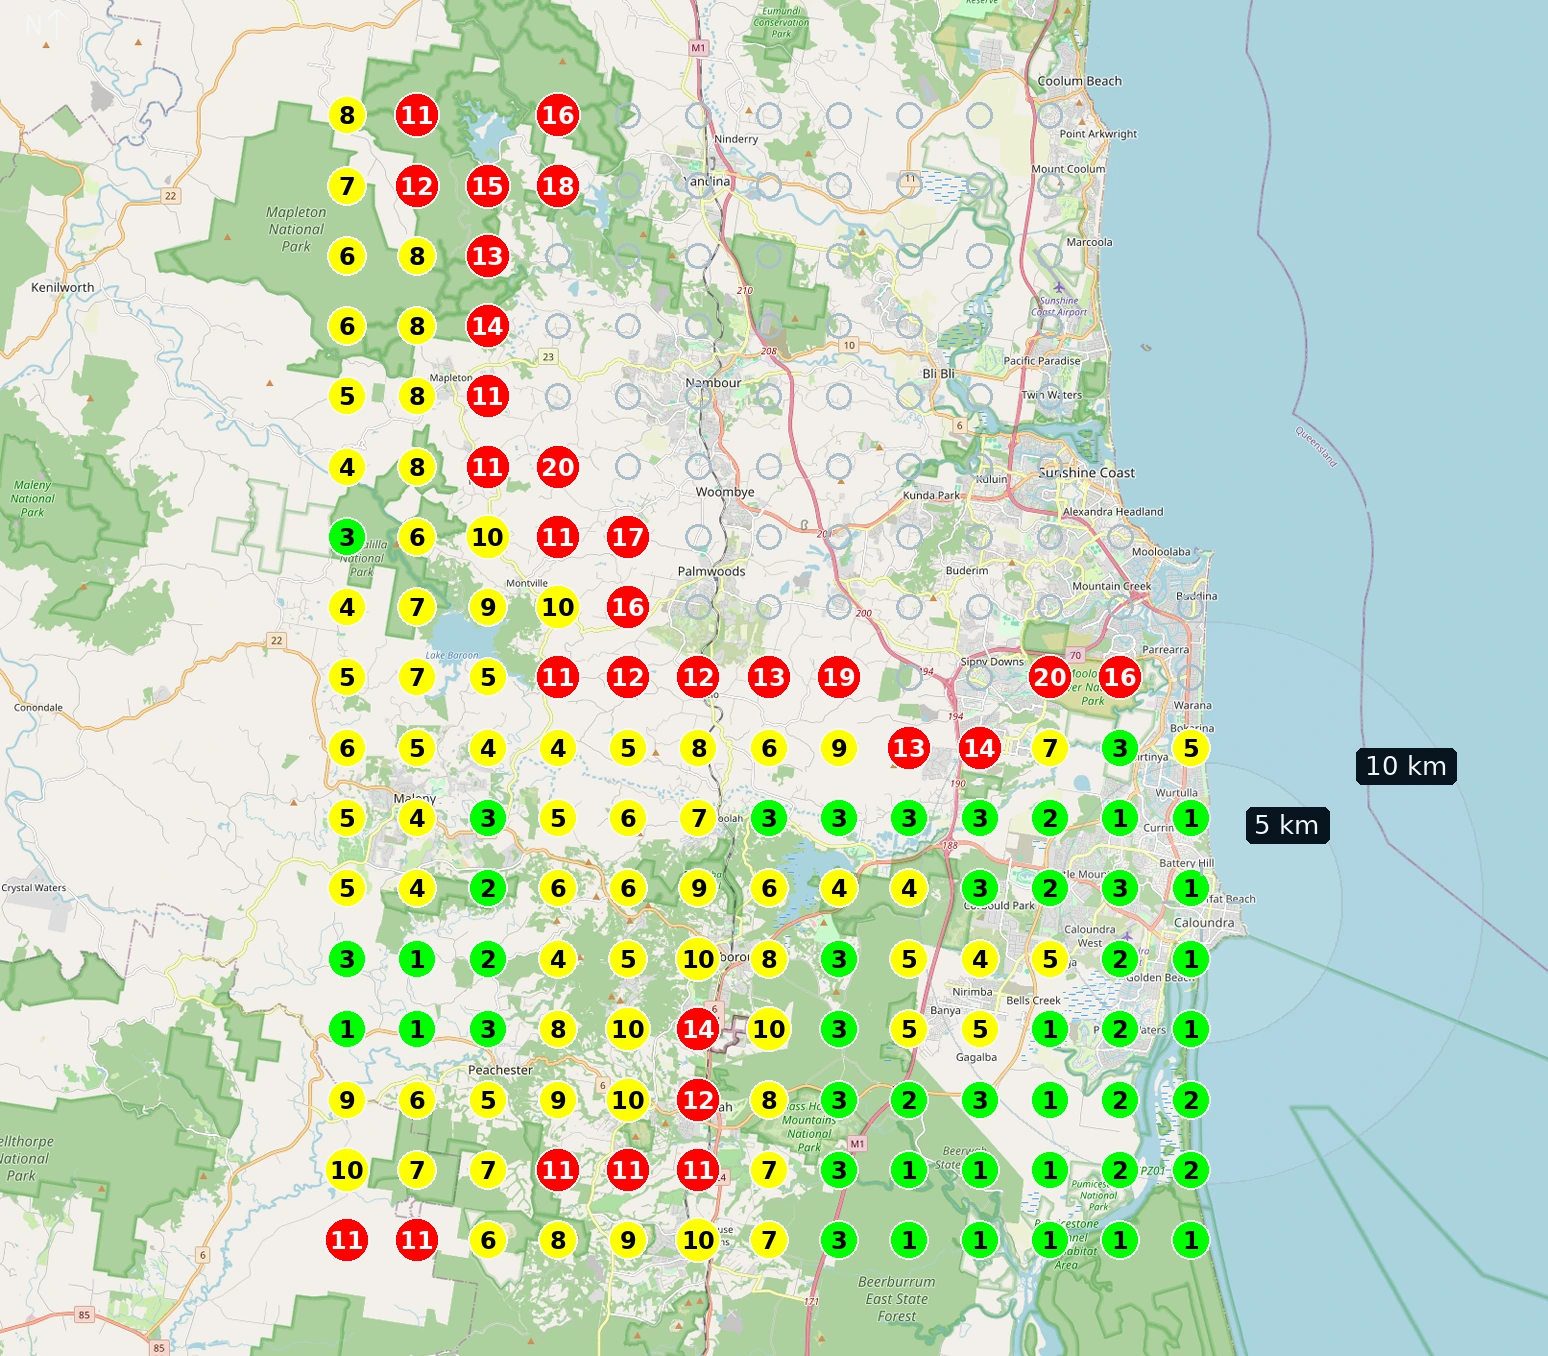
This gives an analyst a concrete place to begin. Check whether the visible strength overlaps the work the owner wants, the territory the business can serve, and the jobs that make commercial sense. The report contains no joined call, lead, or job data, so it cannot answer those questions on its own.
The broad plumber query tells a different story
For plumber, the same report shows two top-three appearances and 27 top-ten appearances. That is a very different pattern for the same business on the same set of origins.
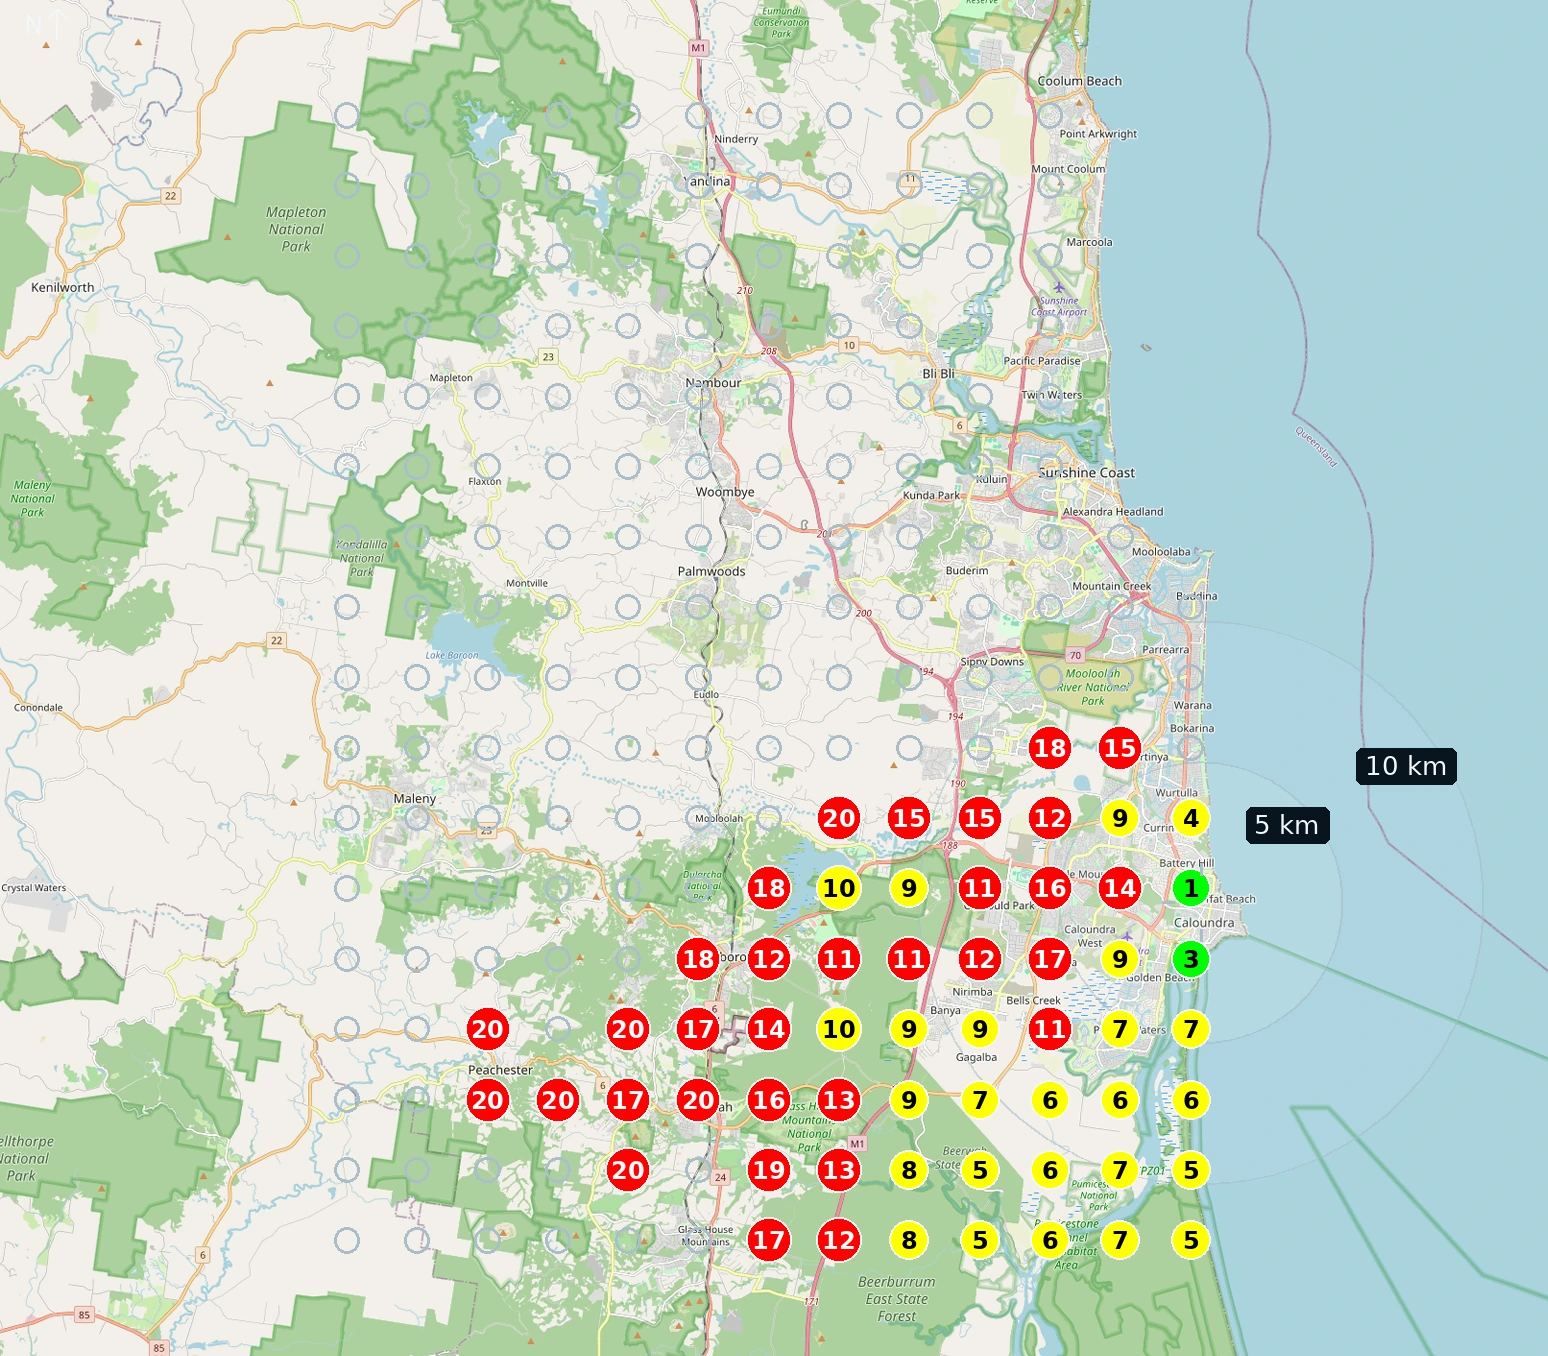
A single statement such as “the business ranks well” would hide this difference. Service-level comparisons give the owner something more specific to discuss with an SEO practitioner.
Emergency plumber and blocked drains deserve their own questions
Emergency plumber records five top-three appearances and 37 top-ten appearances. Blocked drains records one and 11 respectively. Both maps belong in the conversation because they stop the strongest query from standing in for the whole business.
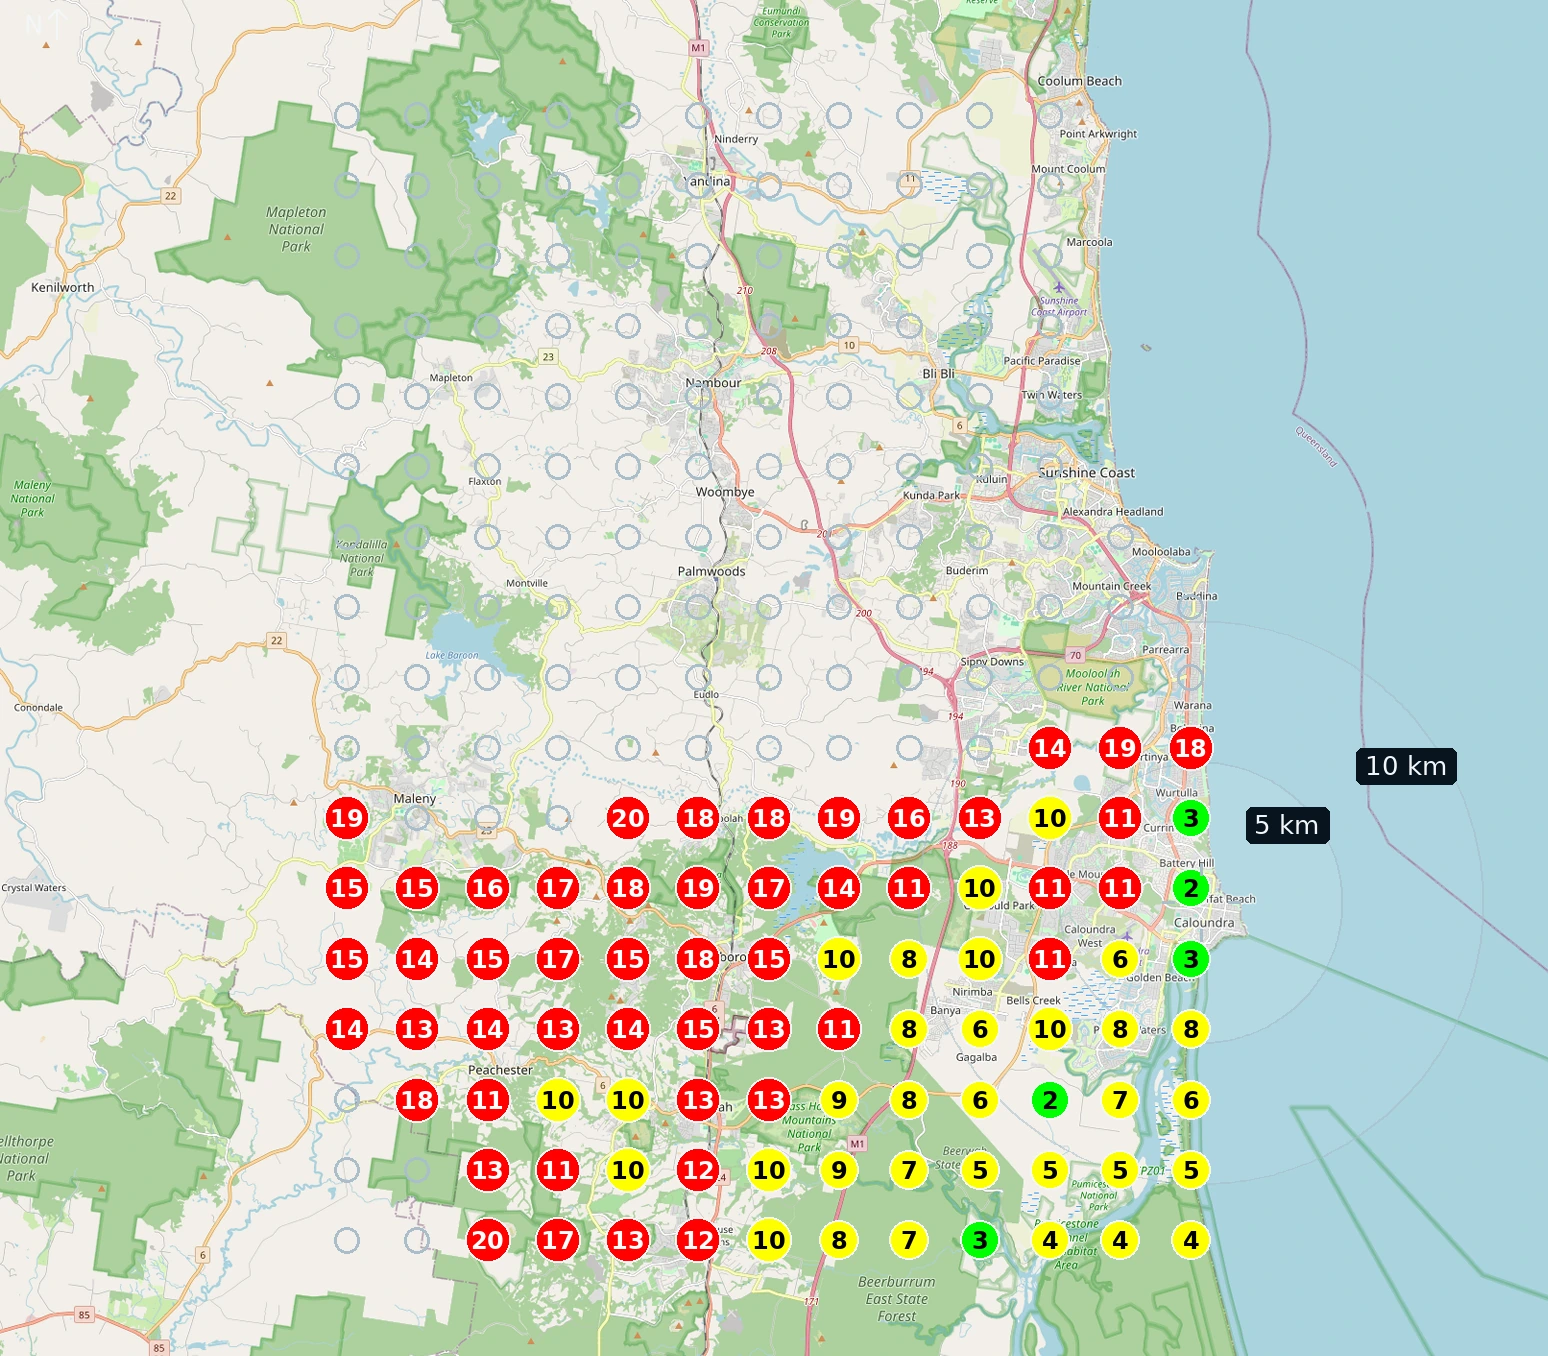
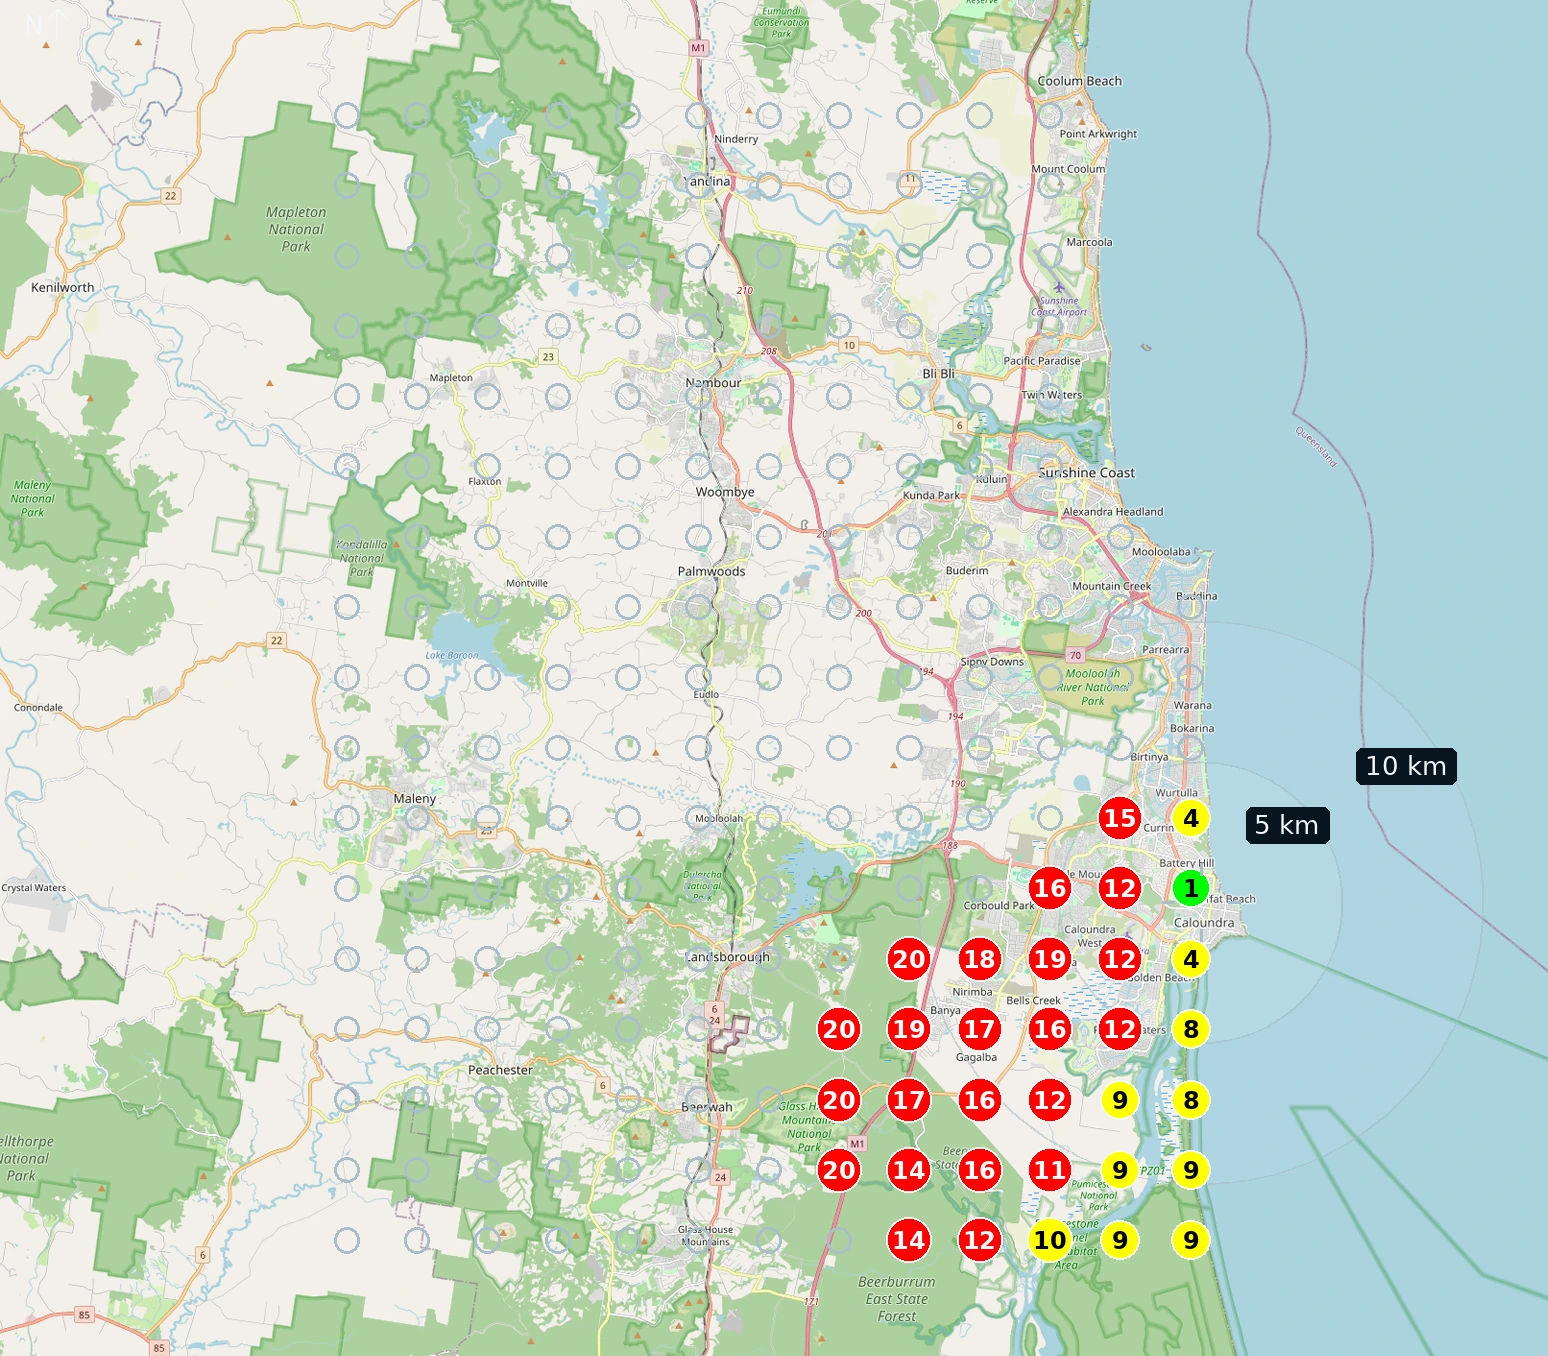
The source proposes checking a sibling profile and a dedicated blocked-drains presence before drawing territory conclusions. Those are sensible investigation questions. The maps do not establish why the profile appears less often for a query, whether another profile serves the area, or which change would improve rankings.
More points give you a different level of detail
The economics report includes two historical Home Slice Pizza maps for the query pizza in Austin. One has 25 search origins; the other has 289. Both are displayed over the same extent.
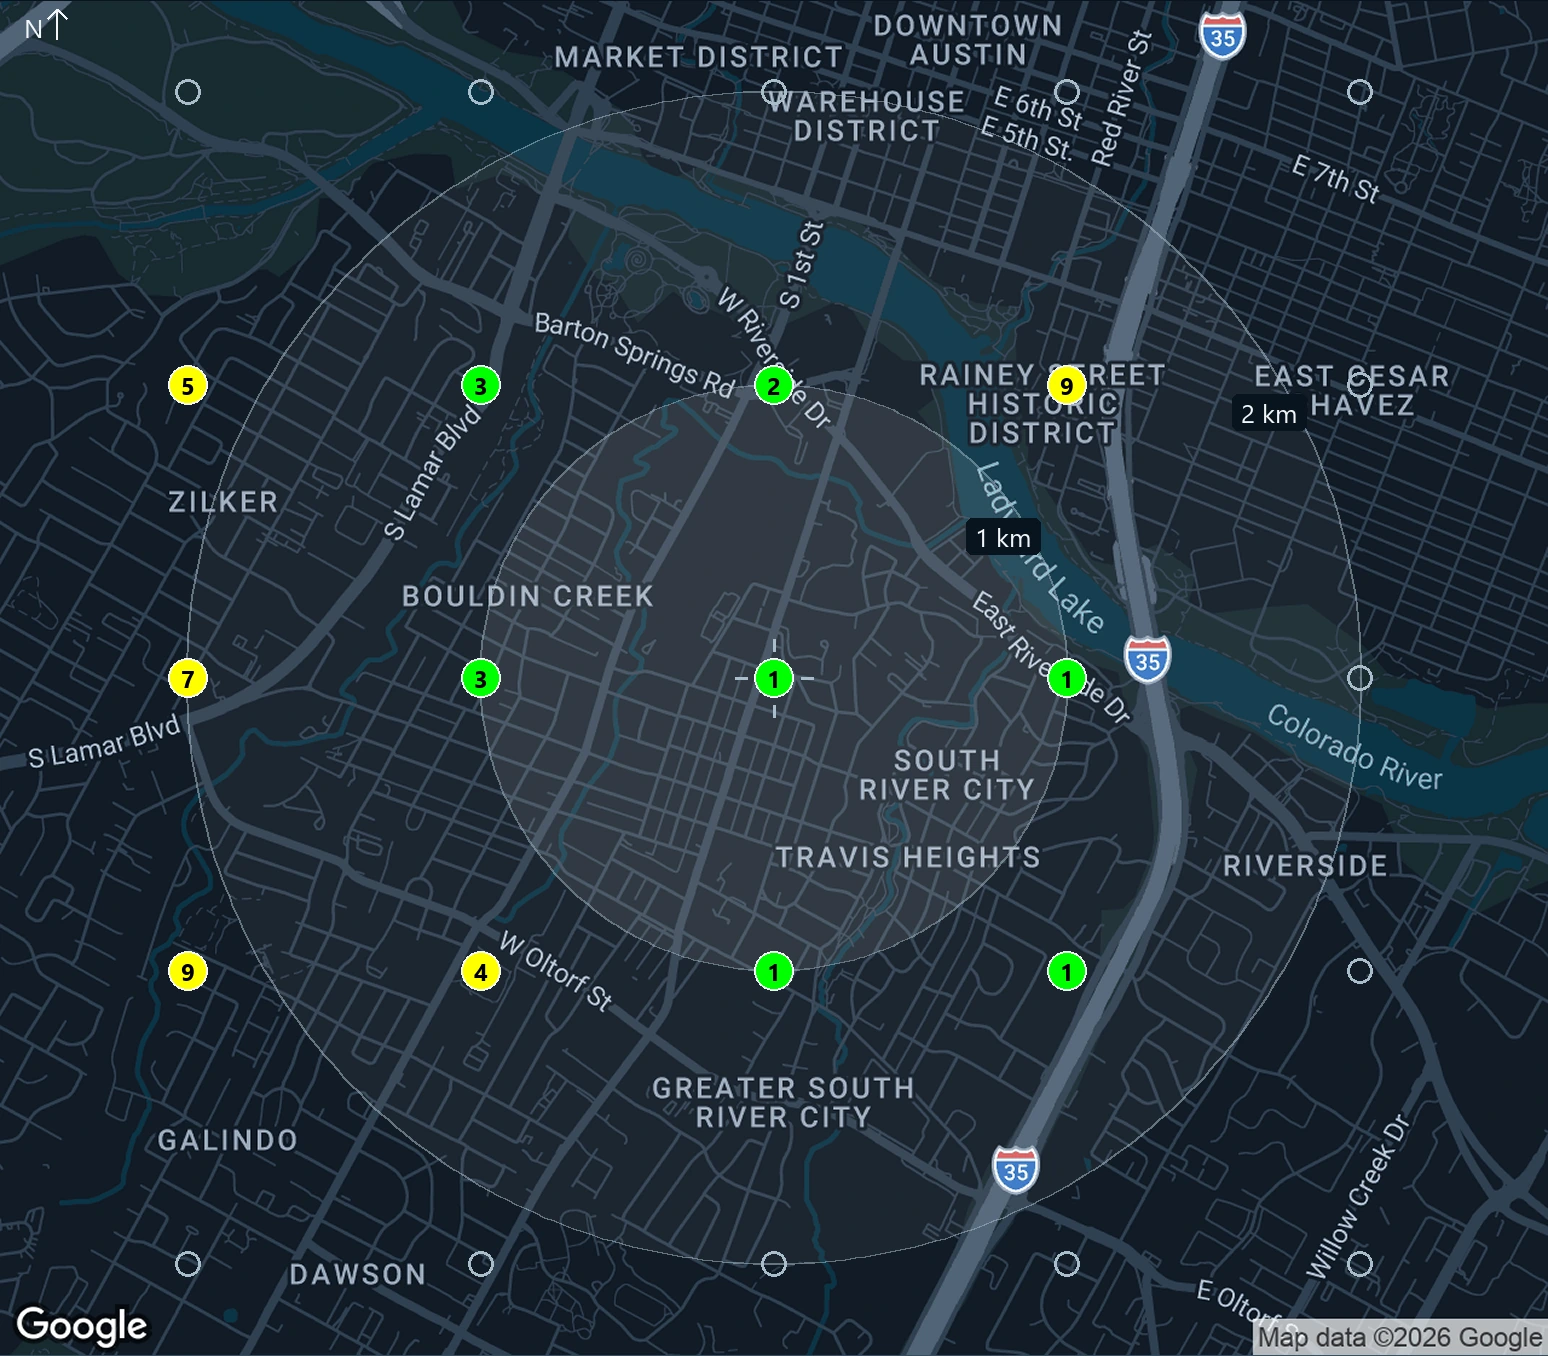
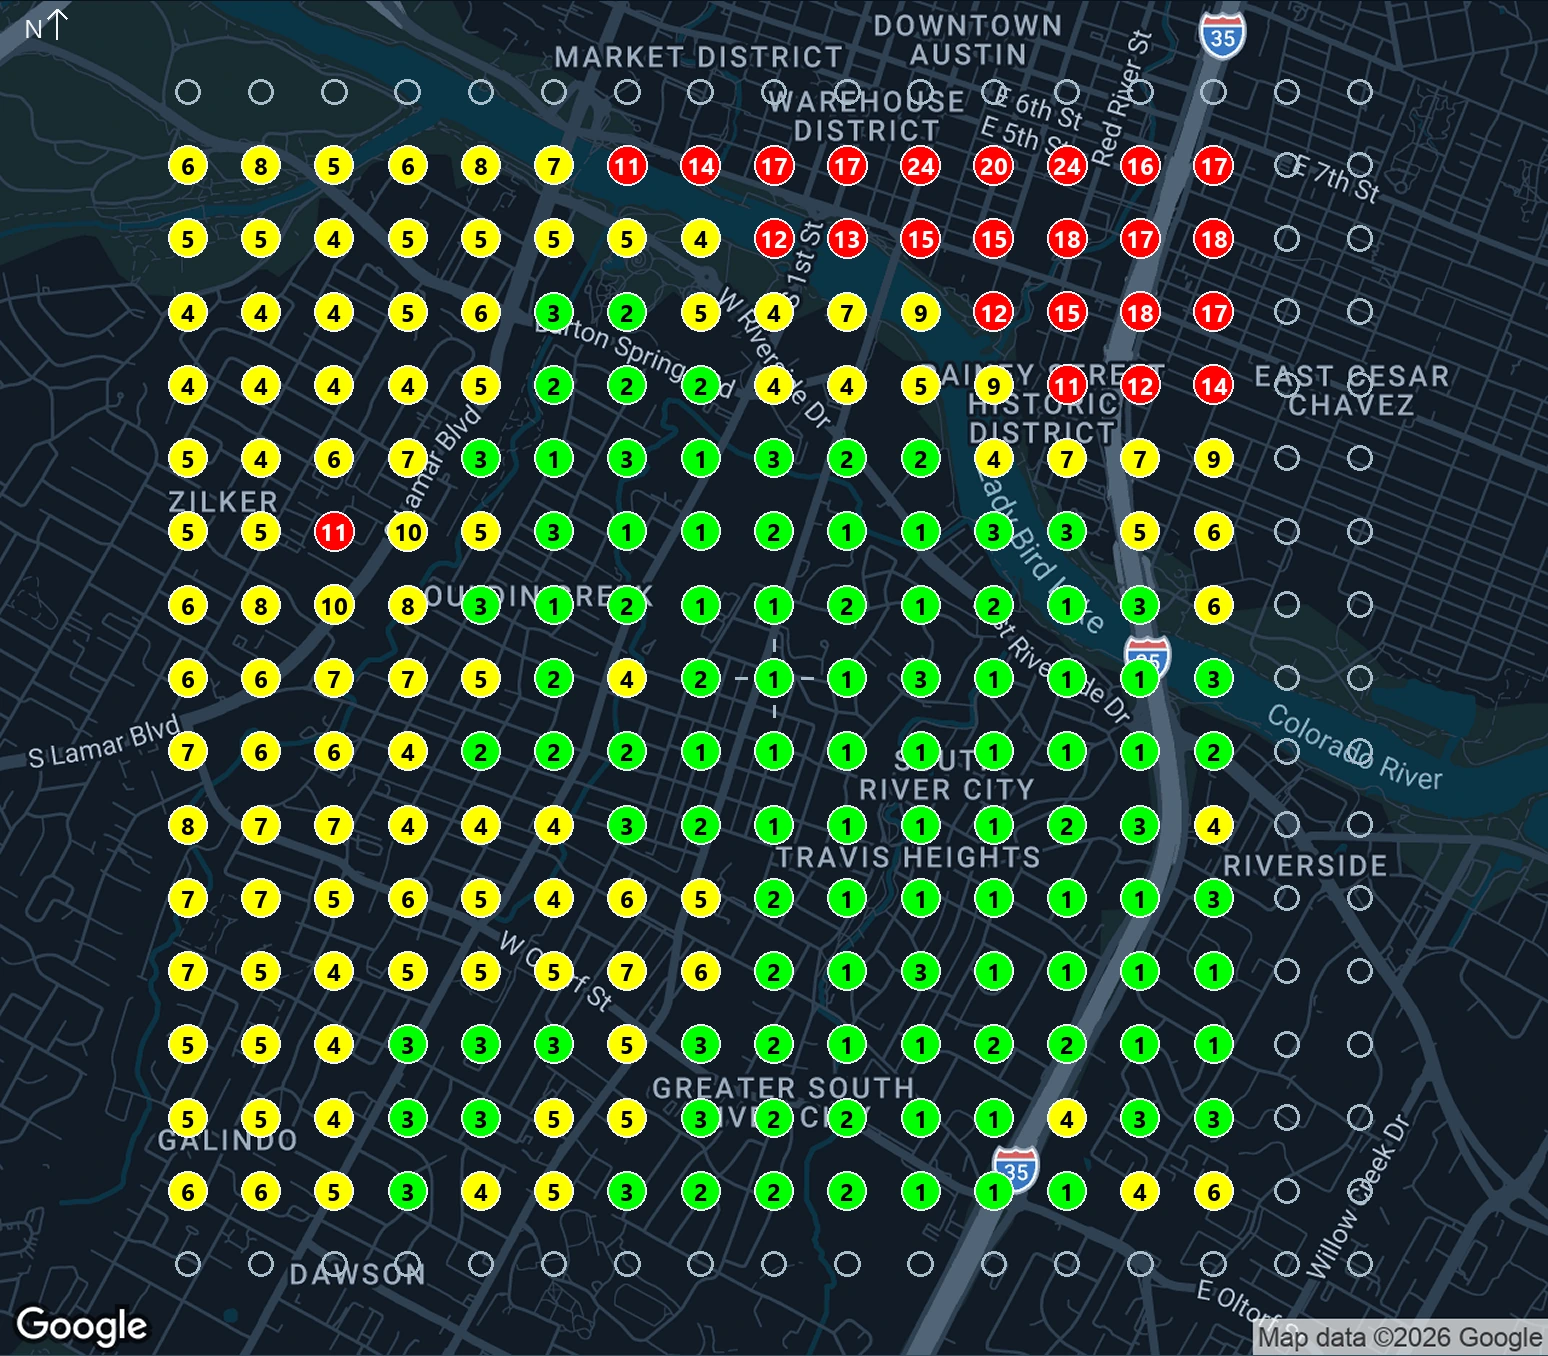
These are separate historical runs. The difference between seven and 100 top-three appearances does not show an SEO improvement, and their shares should not be interpreted as a controlled density experiment.
The practical lesson is about study design. A coarser scan can help frame an initial question; a denser scan can reveal detail worth investigating. Choose spacing and extent for the decision you need to make. Adding points without a question adds work too.
The ranking data can be inexpensive
DataForSEO's Google Maps API pricing page lists base rates of $0.0006 for Standard Queue, $0.0012 for Priority Queue, and $0.002 for Live Mode per SERP page, checked on 19 October 2026. DataForSEO pricing.
Using the Standard base rate, here is the arithmetic for one query and one run:
| Scope | Origins | Modeled base ranking-data cost |
|---|---|---|
| One 5 × 5 grid | 25 | $0.0150 |
| One 9 × 9 grid | 81 | $0.0486 |
| One 17 × 17 grid | 289 | $0.1734 |
| 1,000 businesses, each with a 5 × 5 grid | 25,000 | $15.00 |
Calculation: businesses × queries × origins × runs × base rate. These are illustrative base-rate estimates. Request depth and options can increase consumption. They exclude retries, taxes, funding requirements, map services, compute, setup, maintenance, and analysis.
That is an attractive starting point for someone who wants to own the workflow. It also explains why a tiny data bill should never be presented as the total cost of a client report. A hosted tool may include scheduling, support, account management, and reporting convenience. You need to value those against the work you will take on yourself.
The repository documents explicit execution and cost-ceiling controls for fresh scans. Review the exact plan and current provider rates before authorizing collection. A software estimate is not a provider-enforced billing guarantee. Project cost controls.
The current project goes beyond a static heatmap
The current companion documentation describes a workspace for comparing observed businesses and queries, examining results at individual locations, and copying selected context into an agent conversation. Those capabilities make the evidence easier to inspect while working through a business question. Companion guide.
The project also documents study enhancement: propose additional detail, identify reusable observations, estimate incremental collection, and preserve the earlier edition. Whether observations can be reused depends on compatible settings and freshness. Enhancement guide.
There is useful discipline in its query-selection policy too. It starts from evidenced offerings and distinct customer needs, then recommends a small set of justified themes. Its default of three to five themes is a product policy, not a Google rule. Query-selection policy.
Treat these as documented capabilities at the reviewed source revision. This article did not run a live provider scan or independently test every feature.
Start with saved evidence, then plan one useful study
The easiest evaluation is the saved demo or an offline sample report. Inspect the maps, read the output, and decide whether the workflow fits how you work before configuring paid collection. The repository provides a sample report route.
For a real business, I would use this sequence:
- Confirm the exact profile. Distinguish physical branches and related listings.
- Choose distinct services. Use offerings the business actually provides and questions the owner cares about.
- Keep comparisons consistent. Record shared origins, date, device, language, depth, zoom, and search-window settings.
- Inspect the returned evidence. Separate found ranks, supported absence, incomplete responses, errors, and unmeasured locations.
- Connect the findings to the business. Ask about service territory, capacity, and job value before recommending an action.
- Buy more detail only when it answers something. Preserve the original report and explain what a repeat or expansion will resolve.
The project's search-window policy is useful reading here: study extent and the search viewport are different controls. More dots do not remove a measurement limitation.
Legends GeoGrid is particularly appealing if you are comfortable managing a local tool and want to inspect the evidence behind a report. The tradeoff is responsibility for setup, data collection, maintenance, and interpretation. My free SEO audit tools guide covers other parts of that toolkit. If that fits your work, this is a project worth exploring.
Start with the Legends GeoGrid repository and saved demo. Read the maps, choose a real business question, and build from there.
Sources, method, and editorial notes
Product claims were checked against repository revision 94b832ab21af2c124cf1355097a64539d064b74f on 19 October 2026. The package at that revision identifies itself as version 0.2.0. The supplied September economics report uses a different version label; this article does not repeat it as a current release claim.
The Sunshine Coast counts and maps come from the user-supplied Sunshine Coast Maps Visibility Report, pages 2 to 7. The Austin maps and reported counts come from Legends GeoGrid Economics & Strategy, September 2026, pages 2 and 3. The six embedded maps were extracted from those PDFs without changing their rank pins. Dates and limitations travel with each example. The original PDF inputs were supplied for this article; their dates and evidence limits are retained here.
The interface update on 20 October 2026 adds three supplied screenshots from the Alpha Mechanical study observed on 18 October, with its naming review labeled updated on 19 October. Their contents are shown as supplied evidence, not a new independently verified scan. The companion documentation was rechecked at revision ba6f893a574a30b5f8a157bdb8c55c383d5b97fc for this update.
No new ranking data was purchased. The source reports were not independently authenticated against raw provider responses. No revenue, lead uplift, ranking improvement, or causal SEO outcome is claimed. The product assessment is editorial judgment based on the cited source and supplied reports.
This article was drafted with AI assistance from the supplied reports and checked against the sources linked above. Read about my work.